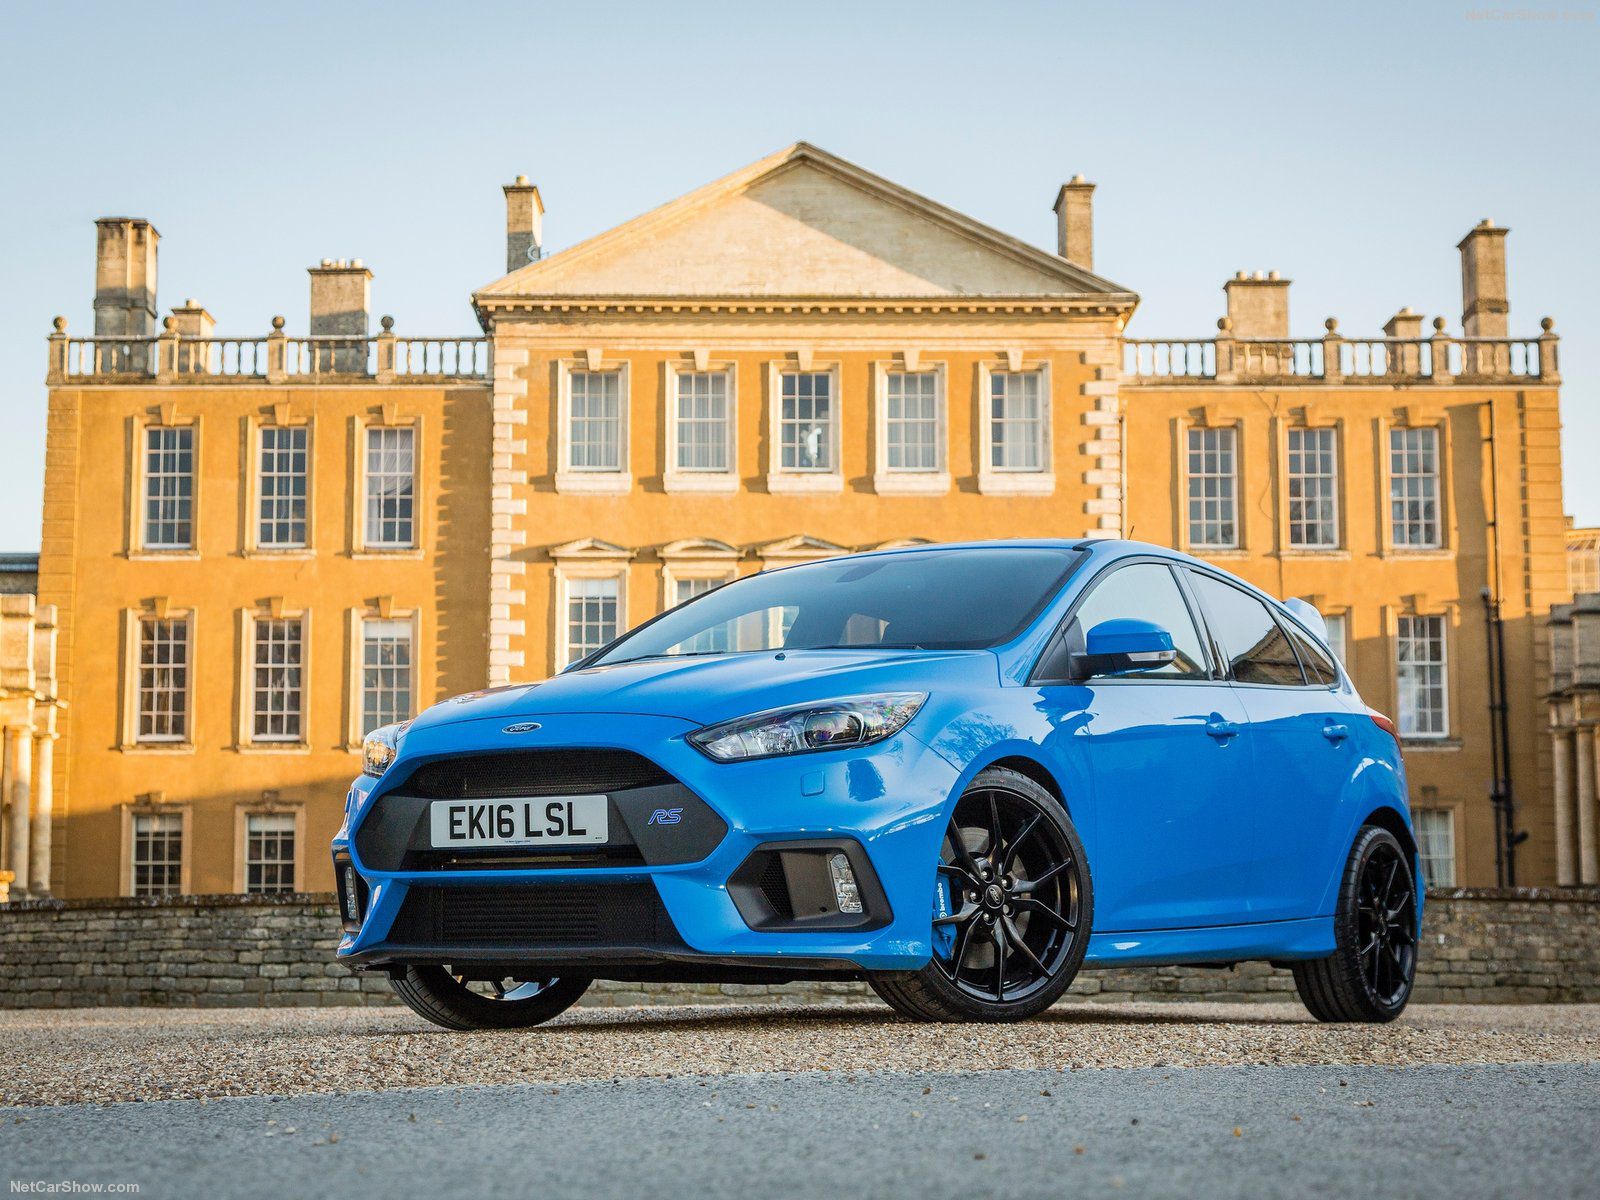
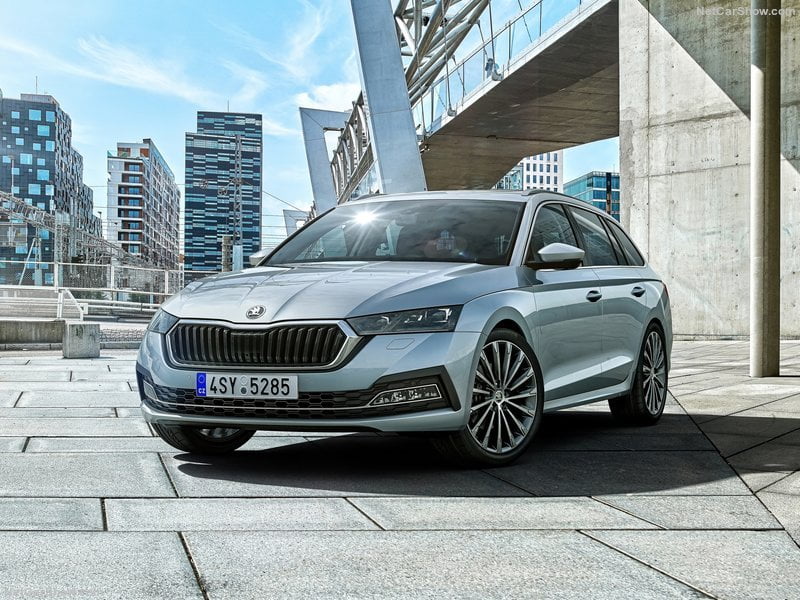
Bosnian vehicles market in 2018 has improved again signing the third year of growth in a row, ending with sales at 9.690 (+1.1%). Skoda is the market leader, ahead of Volkswagen and Opel. The Skoda Octavia is back on top.
Economic Environment
Bosnia economy slowed in the third quarter on sluggish household consumption growth and weaker exports. Nevertheless, total investment and government spending picked up in the quarter. Looking to Q4, the economy likely hummed along at a solid pace thanks to declining unemployment and a buoyant tourist sector.
The outlook for 2019 remains promising. Job creation, higher remittances and a growing tourism sector should boost private consumption, while FDI inflows will likely drive investment. A fragmented government, however, could stall important reforms.
Market Trend
Bosnian vehicles market in recent years has recovered following the deep fall scored in the 2008-2009 crisis. In the last five years annual sales volume grew up from 8.421in the 2012 to 8.870 in the 2016, recovering the 2013 fall. In the 2017, light vehicles sales have been 10.803, up 21.8%.
In the 2018 the car passenger’s market has grown. Indeed, this is the third consecutive year of growth, with sales up 1.1% from last year. The market ended with registrations at 9.690.
| Market | Sales 2014 | Sales 2015 | Sales 2016 | Sales 2017 | Sales 2018 | '+/- 2018 |
|---|---|---|---|---|---|---|
| Car | 6.514 | 6.044 | 7.798 | 9.582 | 9.690 | 1,1% |
Brand-wise, the 2018 market leader is Skoda with 1.808 units (+18.2%) and 18.7% of market share. In second place Volkswagen with 1.548 sales (+6.7%) followed by Opel with 721 (-14.5%) and Dacia with 644 (+5.6%).
| Rank 2018 | Rank 2017 | Sales 2018 | Sales 2017 | '+/- 2018 | Share 2018 | |
|---|---|---|---|---|---|---|
| 1 | 1 | Skoda | 1.808 | 1.530 | 18,2% | 18,7% |
| 2 | 2 | Volkswagen | 1.548 | 1.451 | 6,7% | 16,0% |
| 3 | 3 | Opel | 721 | 843 | -14,5% | 7,4% |
| 4 | 5 | Dacia | 644 | 610 | 5,6% | 6,6% |
| 5 | 7 | Toyota | 608 | 597 | 1,8% | 6,3% |
| 6 | 4 | Renault | 524 | 616 | -14,9% | 5,4% |
| 7 | 8 | Hyundai | 423 | 483 | -12,4% | 4,4% |
| 8 | 9 | Peugeot | 422 | 422 | 0,0% | 4,4% |
| 9 | 6 | Ford | 409 | 598 | -31,6% | 4,2% |
| 10 | 11 | Citroen | 348 | 326 | 6,7% | 3,6% |
| Rank 2018 | Rank 2017 | Sales 2018 | Sales 2017 | '+/- 2018 | Share 2018 | |
|---|---|---|---|---|---|---|
| 1 | 1 | Volkswagen Group | 3.944 | 3.638 | 8,4% | 40,7% |
| 2 | 2 | P.S.A. | 1.491 | 1.591 | -6,3% | 15,4% |
| 3 | 3 | Renault Nissan Alliance | 1.458 | 1.406 | 3,7% | 15,0% |
| 4 | 4 | Hyundai-Kia | 677 | 775 | -12,6% | 7,0% |
| 5 | 6 | Toyota Group | 608 | 597 | 1,8% | 6,3% |
| 6 | 5 | Ford Group | 409 | 598 | -31,6% | 4,2% |
| 7 | 8 | Mercedes Daimler | 272 | 233 | 16,7% | 2,8% |
| 8 | 9 | F.C.A. | 229 | 184 | 24,5% | 2,4% |
| 9 | 7 | Suzuki | 223 | 255 | -12,5% | 2,3% |
| 10 | 10 | BMW | 126 | 132 | -4,5% | 1,3% |
| Rank 2018 | Rank 2017 | Model | Sales 2018 | Sales 2017 | '+/- 2018 |
|---|---|---|---|---|---|
| 1 | 2 | Skoda Octavia | 595 | 487 | 22,2% |
| 2 | 5 | Skoda Fabia | 543 | 357 | 52,1% |
| 3 | 1 | Volkswagen Golf | 430 | 526 | -18,3% |
| 4 | 6 | Volkswagen Passat | 359 | 283 | 26,9% |
| 5 | 4 | Opel Astra | 303 | 402 | -24,6% |
| 6 | 7 | Dacia Duster | 280 | 282 | -0,7% |
| 7 | 9 | Dacia Sandero | 259 | 236 | 9,7% |
| 8 | 13 | Skoda Rapid | 244 | 201 | 21,4% |
| 8 | 10 | Hyundai Tucson | 244 | 233 | 4,7% |
| 9 | 16 | Toyota Yaris | 225 | 158 | 42,4% |
| 10 | 11 | Volkswagen Polo | 220 | 223 | -1,3% |


