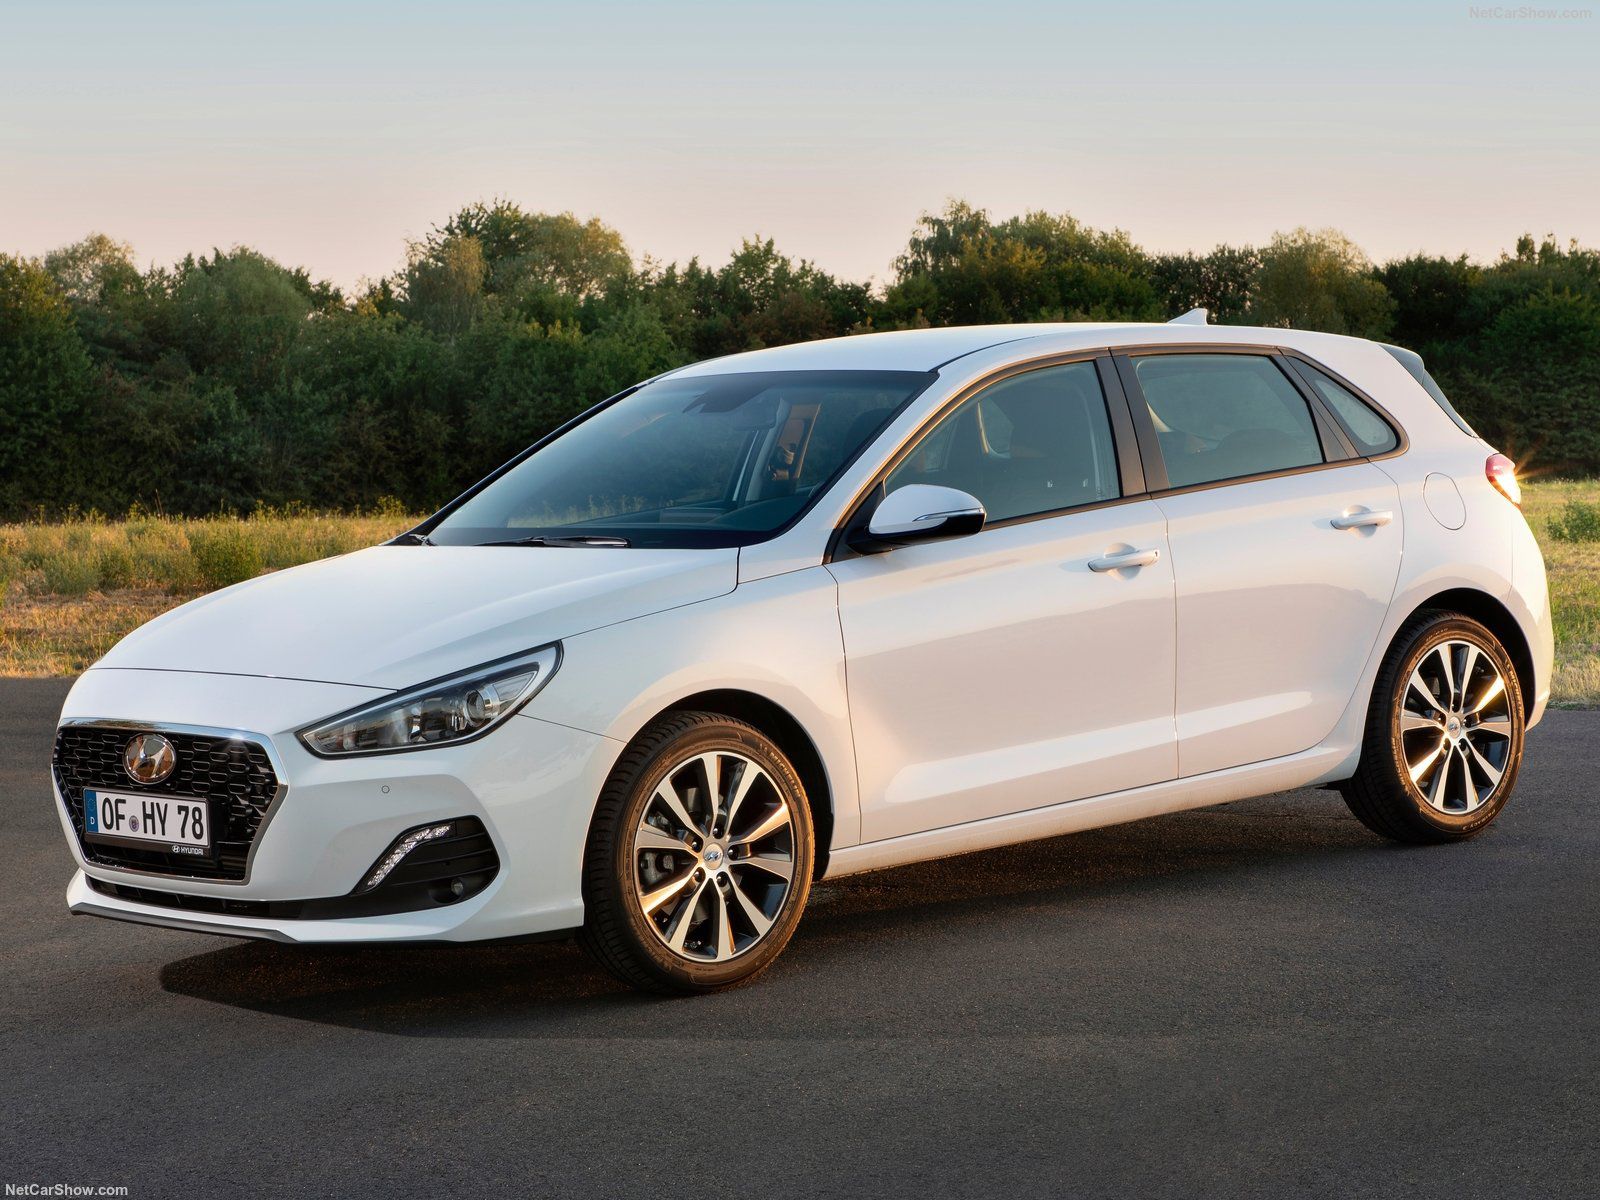
Ukrainian Cars market in the 2018 went marginally down, hit by the large drop in December – down 10.3% – closing with registrations at 80.742 (-2.4%). Toyota kept the market lead, with 12.3% of market share, while Nissan jumped in 4th place, up 28.1%.
Economic Environment
Ukrainian economy momentum remained largely stable in the fourth quarter. Retail sales edged up in November, against the backdrop of higher consumer confidence and despite an uptick in inflation. On a less positive note, industrial output contracted in the same month, reflecting weakness in the all-important manufacturing sector.
Buoyant domestic demand will remain firmly in the driver’s seat of the expansion this year, although growth will lose some steam from 2018. Solid private consumption, helped by a tightening labor market and strong investment activity growth, will be somewhat offset by weaker external demand. Meanwhile, election-related uncertainties cloud the outlook.
Market Trend
Ukrainian vehicles market has been hit both by economic and political crisis falling down at near one tenth of the record level (over 600.000 sales) achieved over a decade ago. The negative peak was hit in the 2015, with only 58.237 units sold. Then, according to data released by the Ukrautoprom, the market started a progressive recovery with 2016 at 68.743 units and 2017 at 91.549, up a robust +32.5%.
In the 2018 the market has lost steam after the previous year strong acceleration. Indeed, after the positive performance of the past year, sales fell down 2.4% largely influenced by a big drop in December – down 11.3% – ending the year with 80.742 units sold.
| Sales 2014 | Sales 2015 | Sales 2016 | Sales 2017 | Sales 2018 | '+/- 2018 |
|---|---|---|---|---|---|
| 154.069 | 81.635 | 65.516 | 82.729 | 80.742 | -2,4% |
Competitive Arena
Brand-wise, the 2018 market leader is again Toyota with 10.082 units (+4%) with 12.3% of market share.
In second place, Renault, with 8.722 sales (+0.6%) followed by Volkswagen with 6.183 units (-5.2%), Nissan, up three spots, with 5.537 (+28.1%) and Skoda with 5.403 (-4.8%).
At model wise, the new leader is the Renault Duster with 3.465 (+15.8%) followed by the Kia Sportage with 3.128 sales (-15.8%) and the Toyota RAV4 with 2.653 (-5.2%).
| Rank 2018 | Rank 2017 | Sales 2018 | Sales 2017 | '+/- 2018 | Share 2018 | |
|---|---|---|---|---|---|---|
| 1 | 1 | Toyota | 10.082 | 9.696 | 4,0% | 12,3% |
| 2 | 2 | Renault | 8.722 | 8.671 | 0,6% | 10,7% |
| 3 | 3 | Volkswagen | 6.183 | 6.525 | -5,2% | 7,6% |
| 4 | 7 | Nissan | 5.537 | 4.324 | 28,1% | 6,8% |
| 5 | 4 | Skoda | 5.403 | 5.675 | -4,8% | 6,6% |
| 6 | 6 | Hyundai | 4.979 | 4.356 | 14,3% | 6,1% |
| 7 | 5 | Kia | 4.881 | 5.320 | -8,3% | 6,0% |
| 8 | 8 | Ford | 3.128 | 3.524 | -11,2% | 3,8% |
| 9 | 12 | Mazda | 3.126 | 2.765 | 13,1% | 3,8% |
| 10 | 11 | Audi | 2.917 | 2.822 | 3,4% | 3,6% |
| 11 | 9 | Mercedes | 2.653 | 2.897 | -8,4% | 3,2% |
| 12 | 13 | Suzuki | 2.619 | 2.496 | 4,9% | 3,2% |
| 13 | 16 | Peugeot | 2.200 | 1.894 | 16,2% | 2,7% |
| 14 | 15 | Mitsubishi | 2.195 | 2.091 | 5,0% | 2,7% |
| 15 | 10 | BMW | 2.148 | 2.832 | -24,2% | 2,6% |
| 16 | 18 | Lexus | 1.563 | 1.371 | 14,0% | 1,9% |
| 17 | 19 | Citroen | 1.429 | 1.256 | 13,8% | 1,7% |
| 18 | 14 | Ravon | 1.295 | 2.367 | -45,3% | 1,6% |
| 19 | 27 | Chery | 1.207 | 631 | 91,3% | 1,5% |
| 20 | 28 | Honda | 972 | 561 | 73,3% | 1,2% |
| 21 | 26 | Fiat | 911 | 707 | 28,9% | 1,1% |
| 22 | 25 | Subaru | 890 | 721 | 23,4% | 1,1% |
| 23 | 21 | Land Rover | 781 | 819 | -4,6% | 1,0% |
| 24 | 23 | Volvo | 758 | 769 | -1,4% | 0,9% |
| 25 | 22 | Chevrolet | 636 | 813 | -21,8% | 0,8% |
| 26 | 24 | Lada | 573 | 767 | -25,3% | 0,7% |
| 27 | 30 | Porsche | 569 | 418 | 36,1% | 0,7% |
| 28 | 17 | ZAZ | 541 | 1.708 | -68,3% | 0,7% |
| 29 | 29 | Infiniti | 445 | 433 | 2,8% | 0,5% |
| 30 | 20 | Seat | 355 | 934 | -62,0% | 0,4% |
| 31 | 32 | Geely | 354 | 277 | 27,8% | 0,4% |
| 32 | 33 | Great Wall | 307 | 260 | 18,1% | 0,4% |
| 33 | 37 | JAC | 236 | 154 | 53,2% | 0,3% |
| 34 | 43 | Tesla | 213 | 54 | 294,4% | 0,3% |
| 35 | 31 | Opel | 209 | 293 | -28,7% | 0,3% |
| 36 | 34 | Jaguar | 208 | 197 | 5,6% | 0,3% |
| 37 | 36 | Jeep | 171 | 161 | 6,2% | 0,2% |
| 38 | 35 | Mini | 150 | 185 | -18,9% | 0,2% |
| 39 | 42 | Maserati | 40 | 57 | -29,8% | |
| 40 | 45 | Bentley | 38 | 29 | 31,0% | |
| 41 | 40 | Smart | 37 | 71 | -47,9% | |
| 42 | 44 | UAZ | 26 | 49 | -46,9% | |
| 43 | 51 | Lincoln | 21 | 1 | 2000,0% | |
| 44 | 47 | Alfa Romeo | 20 | 10 | 100,0% | |
| 45 | 41 | SsangYong | 19 | 64 | -70,3% | |
| 45 | 39 | Acura | 19 | 82 | -76,8% | |
| 46 | 50 | Buick | 14 | 2 | 600,0% | |
| 47 | 48 | Cadillac | 9 | 5 | 80,0% | |
| 47 | 52 | GMC | 9 | - | ||
| 48 | 49 | Dodge | 6 | 3 | 100,0% | |
| 49 | 50 | Aston Martin | 3 | 2 | 50,0% | |
| 49 | 50 | Rolls-Royce | 3 | 2 | 50,0% | |
| 50 | 52 | Tata | - | - |
| Rank 2018 | Rank 2017 | Sales 2018 | Sales 2017 | '+/- 2018 | Share 2018 | |
|---|---|---|---|---|---|---|
| 1 | 2 | Renault Nissan Alliance | 17.472 | 16.286 | 7,3% | 21,6% |
| 2 | 1 | Volkswagen Group | 15.465 | 16.403 | -5,7% | 19,2% |
| 3 | 3 | Toyota Group | 11.645 | 11.067 | 5,2% | 14,4% |
| 4 | 4 | Hyundai-Kia | 9.860 | 9.676 | 1,9% | 12,2% |
| 5 | 6 | P.S.A. | 3.838 | 3.443 | 11,5% | 4,8% |
| 6 | 5 | Ford Group | 3.149 | 3.525 | -10,7% | 3,9% |
| 7 | 10 | Mazda | 3.126 | 2.765 | 13,1% | 3,9% |
| 8 | 9 | Mercedes Daimler | 2.690 | 2.968 | -9,4% | 3,3% |
| 9 | 11 | Suzuki | 2.619 | 2.496 | 4,9% | 3,2% |
| 10 | 8 | BMW | 2.301 | 3.019 | -23,8% | 2,8% |
| Rank 2018 | Rank 2017 | Model | Sales 2018 | Sales 2017 | '+/- 2018 |
|---|---|---|---|---|---|
| 1 | 2 | Renault Duster | 3.465 | 2.992 | 15,8% |
| 2 | 1 | Kia Sportage | 3.128 | 3.714 | -15,8% |
| 3 | 4 | Toyota RAV4 | 2.653 | 2.798 | -5,2% |
| 4 | 8 | Toyota Camry | 2.404 | 1.673 | 43,7% |
| 5 | 3 | Renault Logan | 2.385 | 2.802 | -14,9% |
| 6 | 6 | Hyundai Tucson | 2.229 | 1.844 | 20,9% |
| 7 | 10 | Nissan Qashqai | 2.197 | 1.518 | 44,7% |
| 8 | 5 | Skoda Octavia | 2.138 | 2.576 | -17,0% |
| 9 | 11 | Volkswagen Polo | 1.812 | 1.426 | 27,1% |
| 10 | 16 | Nissan X-Trail | 1.732 | 1.301 | 33,1% |
| 11 | 13 | Mazda CX-5 | 1.706 | 1.330 | 28,3% |
| 12 | 14 | Renault Sandero | 1.581 | 1.315 | 20,2% |
| 13 | 12 | Volkswagen Golf | 1.500 | 1.392 | 7,7% |
| 14 | 27 | Audi A3 | 1.439 | 906 | 58,8% |
| 15 | 28 | Toyota Prado | 1.349 | 886 | 52,3% |
| 16 | 19 | Suzuki Vitara | 1.331 | 1.211 | 9,9% |
| 17 | 7 | Toyota Corolla | 1.225 | 1.775 | -31,0% |
| 18 | 18 | Mercedes GLE | 1.150 | 1.218 | -5,6% |
| 19 | 21 | Nissan Juke | 1.123 | 1.168 | -3,9% |
| 20 | 20 | Mitsubishi Outlander | 1.083 | 1.172 | -7,6% |
| 21 | 15 | Skoda Rapid | 1.046 | 1.313 | -20,3% |
| 22 | 25 | Suzuki SX4 | 1.039 | 942 | 10,3% |
| 23 | 31 | Volkswagen Passat | 1.034 | 812 | 27,3% |
| 24 | 43 | Hyundai Elantra | 936 | 565 | 65,7% |
| 25 | 30 | Ford Focus | 882 | 829 | 6,4% |
| 26 | 44 | Skoda Kodiaq | 878 | 545 | 61,1% |
| 27 | 32 | Ford Kuga | 863 | 797 | 8,3% |
| 28 | 40 | Peugeot 301 | 854 | 662 | 29,0% |
| 29 | 34 | BMW X5 | 843 | 745 | 13,2% |
| 30 | 17 | Volkswagen Tiguan | 822 | 1.293 | -36,4% |


