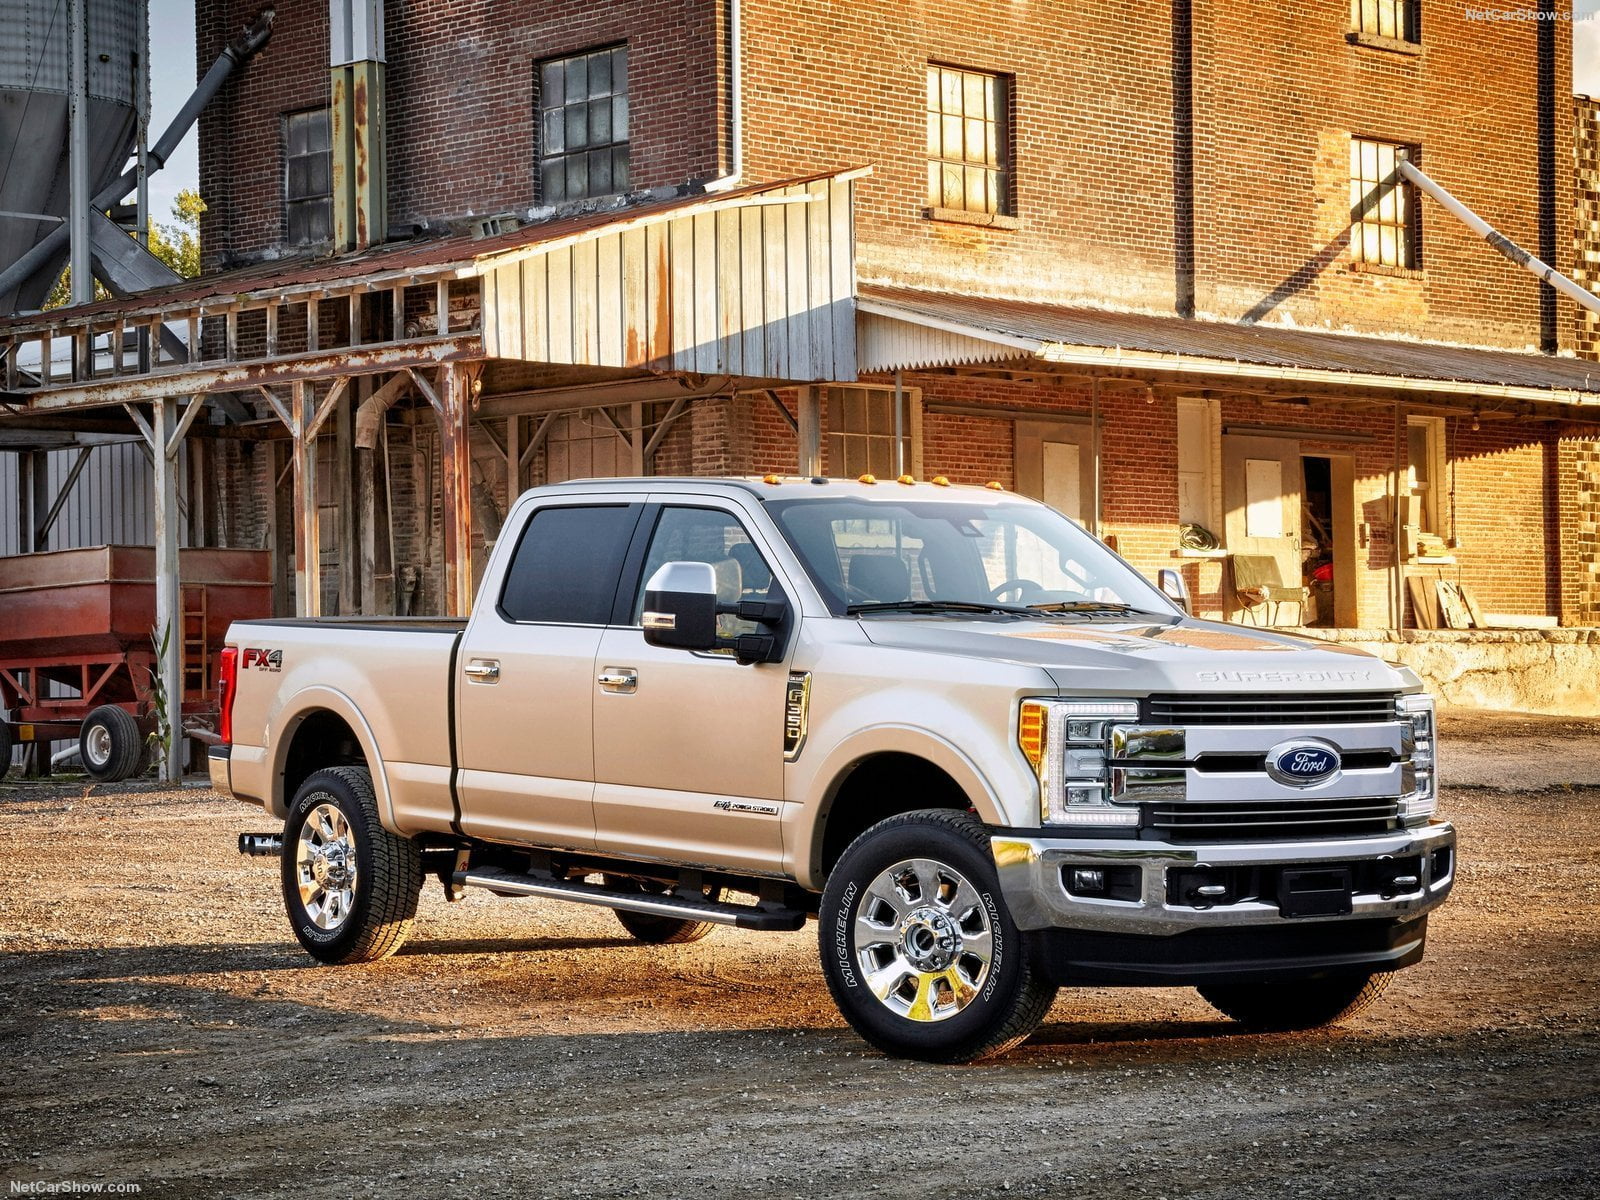
USA best selling cars ranking 2015 is led by Ford F Series as in all the last 39 years. This year the pick up advanced in third place worldwide!. Toyota Camry was again the best car in the market as in the last 14 years.
Best selling models
The 3 best-selling models in the U.S. are all pickup trucks for the 2nd year running and only the third time in the past two decades along with 2003 and 2014. Boosted by the new aluminium F-150, the Ford F-Series remains the best-selling vehicle in the county for the 34th consecutive year (no interruption since 1982) with sales back up 4% to 780.354, the nameplate’s highest annual score since 2006 (796.039). Now the F-150 advanced in third place among global ranking.
The F-Series has now been the best-selling pickup truck in the U.S. for 39 years in a row since 1977. Chevrolet took advantage of a wobbly F-150 generational transition early in the year by lifting incentives on the Silverado up 13% to 600.544. With the GMC Sierra up 6% to 224.139, GM’s line of full-size pickups outsells the Ford F-Series for the first time since 2009.
The Toyota Camry remains America’s favourite car for the 14th year in a row and for the 18th time in the past 19 years with stable sales (429.355). It distances the Toyota Corolla (+7%) while the Honda Accord drops one spot and 8% and the Honda Civic (+3%) overtakes the Nissan Altima (-1%). The #1 car in the U.S. has consistently been a Japanese nameplate for almost two decades now, ever since the Ford Taurus sold 401.049 units in 1996.
Below, you can sort our interactive tables to see data regarding Brands, Groups and Models. Please bear in mind that sales data are subject to adjustments as sources will update their information. This report is updated at the publishing date and will not be modified while the next on this subject will always have the year to date data updated.
| Rank 2015 | Rank 2014 | Model | Sales 2015 | Sale 2014 | 2015 Var | Share 2015 | Share 2014 |
|---|---|---|---|---|---|---|---|
| 1 | 1 | Ford F-Series | 780.354 | 753.851 | 3,5% | 4,6% | 4,7% |
| 2 | 2 | Chevrolet Silverado | 600.544 | 529.755 | 13,4% | 3,5% | 3,3% |
| 3 | 3 | Toyota Camry | 429.355 | 428.606 | 0,2% | 2,5% | 2,7% |
| 4 | 5 | Toyota Corolla | 363.332 | 339.498 | 7,0% | 2,1% | 2,1% |
| 5 | 4 | Honda Accord | 355.557 | 388.374 | -8,4% | 2,1% | 2,4% |
| 6 | 7 | Honda CR-V | 345.647 | 335.019 | 3,2% | 2,0% | 2,1% |
| 7 | 8 | Honda Civic | 335.384 | 325.981 | 2,9% | 2,0% | 2,0% |
| 8 | 6 | Nissan Altima | 333.398 | 335.644 | -0,7% | 2,0% | 2,1% |
| 9 | 12 | Toyota RAV4 | 315.412 | 267.698 | 17,8% | 1,9% | 1,7% |
| 10 | 10 | Ford Escape | 306.492 | 306.212 | 0,1% | 1,8% | 1,9% |
| 11 | 9 | Ford Fusion | 300.170 | 306.860 | -2,2% | 1,8% | 1,9% |
| 12 | 19 | Nissan Rogue | 287.190 | 199.199 | 44,2% | 1,7% | 1,2% |
| 13 | 13 | Chevrolet Equinox | 277.589 | 242.242 | 14,6% | 1,6% | 1,5% |
| 14 | 18 | Ford Explorer | 249.251 | 209.994 | 18,7% | 1,5% | 1,3% |
| 15 | 14 | Hyundai Elantra | 241.706 | 222.023 | 8,9% | 1,4% | 1,4% |
| 16 | 11 | Chevrolet Cruze | 226.602 | 273.060 | -17,0% | 1,3% | 1,7% |
| 17 | 17 | GMC Sierra | 224.139 | 211.833 | 5,8% | 1,3% | 1,3% |
| 18 | 23 | Jeep Cherokee | 220.260 | 178.508 | 23,4% | 1,3% | 1,1% |
| 19 | 16 | Hyundai Sonata | 213.303 | 216.936 | -1,7% | 1,3% | 1,3% |
| 20 | 22 | Nissan Sentra | 203.509 | 183.268 | 11,0% | 1,2% | 1,1% |
| 21 | 24 | Jeep Wrangler | 202.702 | 175.328 | 15,6% | 1,2% | 1,1% |
| 22 | 15 | Ford Focus | 202.478 | 219.634 | -7,8% | 1,2% | 1,4% |
| 23 | 21 | Jeep Grand Cherokee | 195.958 | 183.347 | 6,9% | 1,2% | 1,1% |
| 24 | 20 | Chevrolet Malibu | 194.854 | 188.519 | 3,4% | 1,1% | 1,2% |
| 25 | 28 | Toyota Tacoma | 179.562 | 155.041 | 15,8% | 1,1% | 1,0% |
| 26 | 40 | Chrysler 200 | 177.889 | 117.363 | 51,6% | 1,0% | 0,7% |
| 27 | 26 | Subaru Forester | 175.192 | 159.953 | 9,5% | 1,0% | 1,0% |
| 28 | 27 | Kia Optima | 159.414 | 159.020 | 0,2% | 0,9% | 1,0% |
| 29 | 29 | Toyota Highlander | 158.915 | 146.127 | 8,8% | 0,9% | 0,9% |
| 30 | 33 | Subaru Outback | 152.294 | 138.790 | 9,7% | 0,9% | 0,9% |
| 31 | 30 | Kia Soul | 147.133 | 145.316 | 1,3% | 0,9% | 0,9% |
| 32 | 32 | Nissan Versa | 144.528 | 139.781 | 3,4% | 0,8% | 0,9% |
| 33 | 37 | Toyota Sienna | 137.497 | 124.502 | 10,4% | 0,8% | 0,8% |
| 34 | 42 | Honda Pilot | 136.212 | 108.857 | 25,1% | 0,8% | 0,7% |
| 35 | 25 | Volkswagen Jetta | 131.109 | 160.873 | -18,5% | 0,8% | 1,0% |
| 36 | 38 | Honda Odyssey | 127.736 | 122.738 | 4,1% | 0,8% | 0,8% |
| 37 | 41 | Ford Edge | 124.120 | 108.864 | 14,0% | 0,7% | 0,7% |
| 38 | 62 | Ford Mustang | 122.439 | 82.635 | 48,2% | 0,7% | 0,5% |
| 39 | 47 | Chevrolet Traverse | 119.945 | 103.943 | 15,4% | 0,7% | 0,6% |
| 40 | 39 | Toyota Tundra | 118.880 | 118.493 | 0,3% | 0,7% | 0,7% |
| 41 | 57 | Jeep Patriot | 118.464 | 93.462 | 26,8% | 0,7% | 0,6% |
| 42 | 43 | Hyundai Santa fe | 118.134 | 107.906 | 9,5% | 0,7% | 0,7% |
| 43 | 35 | Toyota Prius | 118.020 | 136.008 | -13,2% | 0,7% | 0,8% |
| 44 | 150 | Ford Transit | 117.577 | 20.448 | 475,0% | 0,7% | 0,1% |
| 45 | 31 | Chevrolet Impala | 116.825 | 140.280 | -16,7% | 0,7% | 0,9% |
| 46 | 48 | Kia Sorento | 116.249 | 102.520 | 13,4% | 0,7% | 0,6% |
| 47 | 45 | GMC Terrain | 112.030 | 105.016 | 6,7% | 0,7% | 0,7% |
| 48 | 50 | Mazda CX-5 | 111.450 | 99.122 | 12,4% | 0,7% | 0,6% |
| 49 | 46 | Mazda3 | 107.885 | 104.985 | 2,8% | 0,6% | 0,7% |
| 50 | 55 | Dodge Journey | 105.400 | 93.572 | 12,6% | 0,6% | 0,6% |
| 51 | 44 | Lexus RX | 100.610 | 107.490 | -6,4% | 0,6% | 0,7% |
| 52 | 61 | Subaru Impreza | 100.519 | 83.488 | 20,4% | 0,6% | 0,5% |
| 53 | 36 | Dodge Grand Caravan | 97.141 | 134.152 | -27,6% | 0,6% | 0,8% |
| 54 | 65 | Toyota 4Runner | 97.034 | 76.906 | 26,2% | 0,6% | 0,5% |
| 55 | 59 | GMC Acadia | 96.393 | 83.972 | 14,8% | 0,6% | 0,5% |
| 56 | 54 | Dodge Charger | 94.725 | 94.099 | 0,7% | 0,6% | 0,6% |
| 57 | 49 | BMW 3 Series | 94.527 | 100.970 | -6,4% | 0,6% | 0,6% |
| 58 | 34 | Chrysler Town & Country | 93.848 | 138.040 | -32,0% | 0,6% | 0,9% |
| 59 | 69 | Subaru XV Crosstrek | 88.927 | 70.945 | 25,3% | 0,5% | 0,4% |
| 60 | 52 | Chevrolet Tahoe | 88.342 | 97.726 | -9,6% | 0,5% | 0,6% |
| 61 | 60 | Dodge Dart | 87.392 | 83.858 | 4,2% | 0,5% | 0,5% |
| 62 | 66 | Mercedes C Class | 86.080 | 75.065 | 14,7% | 0,5% | 0,5% |
| 63 | 200 | Chevrolet Colorado | 84.430 | 8.003 | 955,0% | 0,5% | 0,0% |
| 64 | 64 | Nissan Pathfinder | 82.041 | 79.111 | 3,7% | 0,5% | 0,5% |
| 65 | 70 | Kia Forte | 78.919 | 69.336 | 13,8% | 0,5% | 0,4% |
| 66 | 53 | Volkswagen Passat | 78.207 | 96.649 | -19,1% | 0,5% | 0,6% |
| 67 | 51 | Ford Econoline | 77.608 | 98.007 | -20,8% | 0,5% | 0,6% |
| 68 | 58 | Chevrolet Camaro | 77.502 | 86.297 | -10,2% | 0,5% | 0,5% |
| 69 | 82 | Cadillac SRX | 68.850 | 53.578 | 28,5% | 0,4% | 0,3% |
| 70 | 92 | Buick Encore | 67.549 | 48.892 | 38,2% | 0,4% | 0,3% |
| 71 | 79 | Jeep Compass | 66.698 | 61.264 | 8,9% | 0,4% | 0,4% |
| 72 | 88 | Dodge Challenger | 66.365 | 51.611 | 28,6% | 0,4% | 0,3% |
| 73 | 117 | Volkswagen Golf | 65.308 | 33.675 | 93,9% | 0,4% | 0,2% |
| 74 | 68 | Lexus ES | 64.969 | 72.508 | -10,4% | 0,4% | 0,5% |
| 75 | 56 | Chevrolet Sonic | 64.775 | 93.518 | -30,7% | 0,4% | 0,6% |
| 76 | 76 | Ford Fiesta | 64.458 | 63.192 | 2,0% | 0,4% | 0,4% |
| 77 | 74 | Dodge Durango | 64.186 | 64.398 | -0,3% | 0,4% | 0,4% |
| 78 | 96 | Hyundai Tucson | 63.591 | 46.306 | 37,3% | 0,4% | 0,3% |
| 79 | 63 | Chevrolet Express | 63.382 | 79.352 | -20,1% | 0,4% | 0,5% |
| 80 | 259 | Chevrolet Trax | 63.030 | 739 | 0,4% | 0,0% | |
| 81 | 93 | Nissan Murano | 62.907 | 47.301 | 33,0% | 0,4% | 0,3% |
| 82 | 67 | Nissan Frontier | 62.817 | 74.323 | -15,5% | 0,4% | 0,5% |
| 83 | 78 | Buick Enclave | 62.081 | 62.300 | -0,4% | 0,4% | 0,4% |
| 84 | 75 | Hyundai Accent | 61.486 | 63.309 | -2,9% | 0,4% | 0,4% |
| 85 | 278 | Jeep Renegade | 60.946 | - | 0,4% | 0,0% | |
| 86 | 86 | Subaru Legacy | 60.447 | 52.270 | 15,6% | 0,4% | 0,3% |
| 87 | 71 | Toyota Avalon | 60.063 | 67.183 | -10,6% | 0,4% | 0,4% |
| 88 | 73 | Acura MDX | 58.208 | 65.603 | -11,3% | 0,3% | 0,4% |
| 89 | 84 | Mazda6 | 57.898 | 53.224 | 8,8% | 0,3% | 0,3% |
| 90 | 94 | BMW X5 | 54.997 | 47.031 | 16,9% | 0,3% | 0,3% |
| 91 | 101 | Kia Sportage | 53.739 | 42.945 | 25,1% | 0,3% | 0,3% |
| 92 | 83 | Chrysler 300 | 53.109 | 53.382 | -0,5% | 0,3% | 0,3% |
| 93 | 80 | Honda Fit | 52.724 | 59.340 | -11,1% | 0,3% | 0,4% |
| 94 | 100 | Ford Transit connect | 52.221 | 43.210 | 20,9% | 0,3% | 0,3% |
| 95 | 102 | Audi Q5 | 52.006 | 42.420 | 22,6% | 0,3% | 0,3% |
| 96 | 97 | Acura RDX | 51.026 | 44.865 | 13,7% | 0,3% | 0,3% |
| 97 | 81 | Chevrolet Suburban | 50.866 | 55.009 | -7,5% | 0,3% | 0,3% |
| 98 | 72 | Mercedes E Class | 49.736 | 66.400 | -25,1% | 0,3% | 0,4% |
| 99 | 77 | Ford Taurus | 48.816 | 62.629 | -22,1% | 0,3% | 0,4% |
| 100 | 153 | Acura TLX | 47.080 | 19.127 | 146,1% | 0,3% | 0,1% |
Wishing to know more and see our forecast to 2020:


