USA Vehicles Sales in 2018 sales were at 17.3 million, marginally improving from the previous year and gaining the 4th largest annual score ever. FCA is by far the best performing group in the Top 10, up 8.3%. Jeep scored and outstanding performance, improving 17.5%.
Economic Environment
U.S. economy appears to be maintaining a robust—even if likely slightly softening—growth momentum in the fourth quarter, buttressed primarily by upbeat private spending thanks to the winter holiday season. Indeed, consumer confidence remained elevated in November, while retail sales data in the same month signaled private consumption growth will accelerate somewhat in Q4 compared to the previous quarter. This should further be supported by steady job gains in the labor market, fanning upward wage pressures. However, a subdued housing sector should continue to weigh on the economy.
However, the economy is poised to slow due to multiple headwinds, most crucially on rising interest rates, a global growth deceleration, and fading stimulus from the 2017 tax cuts. The main downside risk remains a further escalation of the trade war with China, which could disrupt business activity and weigh on business confidence and investment.
Market Trend
US Vehicles market has promptly reacted at the 2008-2009 financial crisis reporting an impressive increase across the last sixth years ended with the all time record volume hit in the 2016 at 17.5 million units. Finally in the 2017 the market has braked the growth, after seven years, losing marginally (-1.8%) with 17.23 million sales.
In the 2018 the US domestic vehicles market is moderately positive. Indeed, registrations hava closed at 17.340.955 units, reaching the 4th largest annual gain in US history. The market improved 0.6% from last year, ending for the fifth time ever above 17 million annual sales.
| Sales 2014 | Sales 2015 | Sales 2016 | Sales 2017 | Sales 2018 | '+/- 2018 |
|---|---|---|---|---|---|
| 16.527.947 | 17.471.283 | 17.558.919 | 17.237.702 | 17.340.955 | 0,6% |
Competitive Arena
Looking at the annual trend, the 2018 market leader is Ford with 2.38 million units sold (-3.3%) with 13.7% of market share.
In second place Toyota with 2.13 million sales, followed by Chevrolet with 2.03 million (-1.5%) and Honda with 1.45 million (-2.8%).
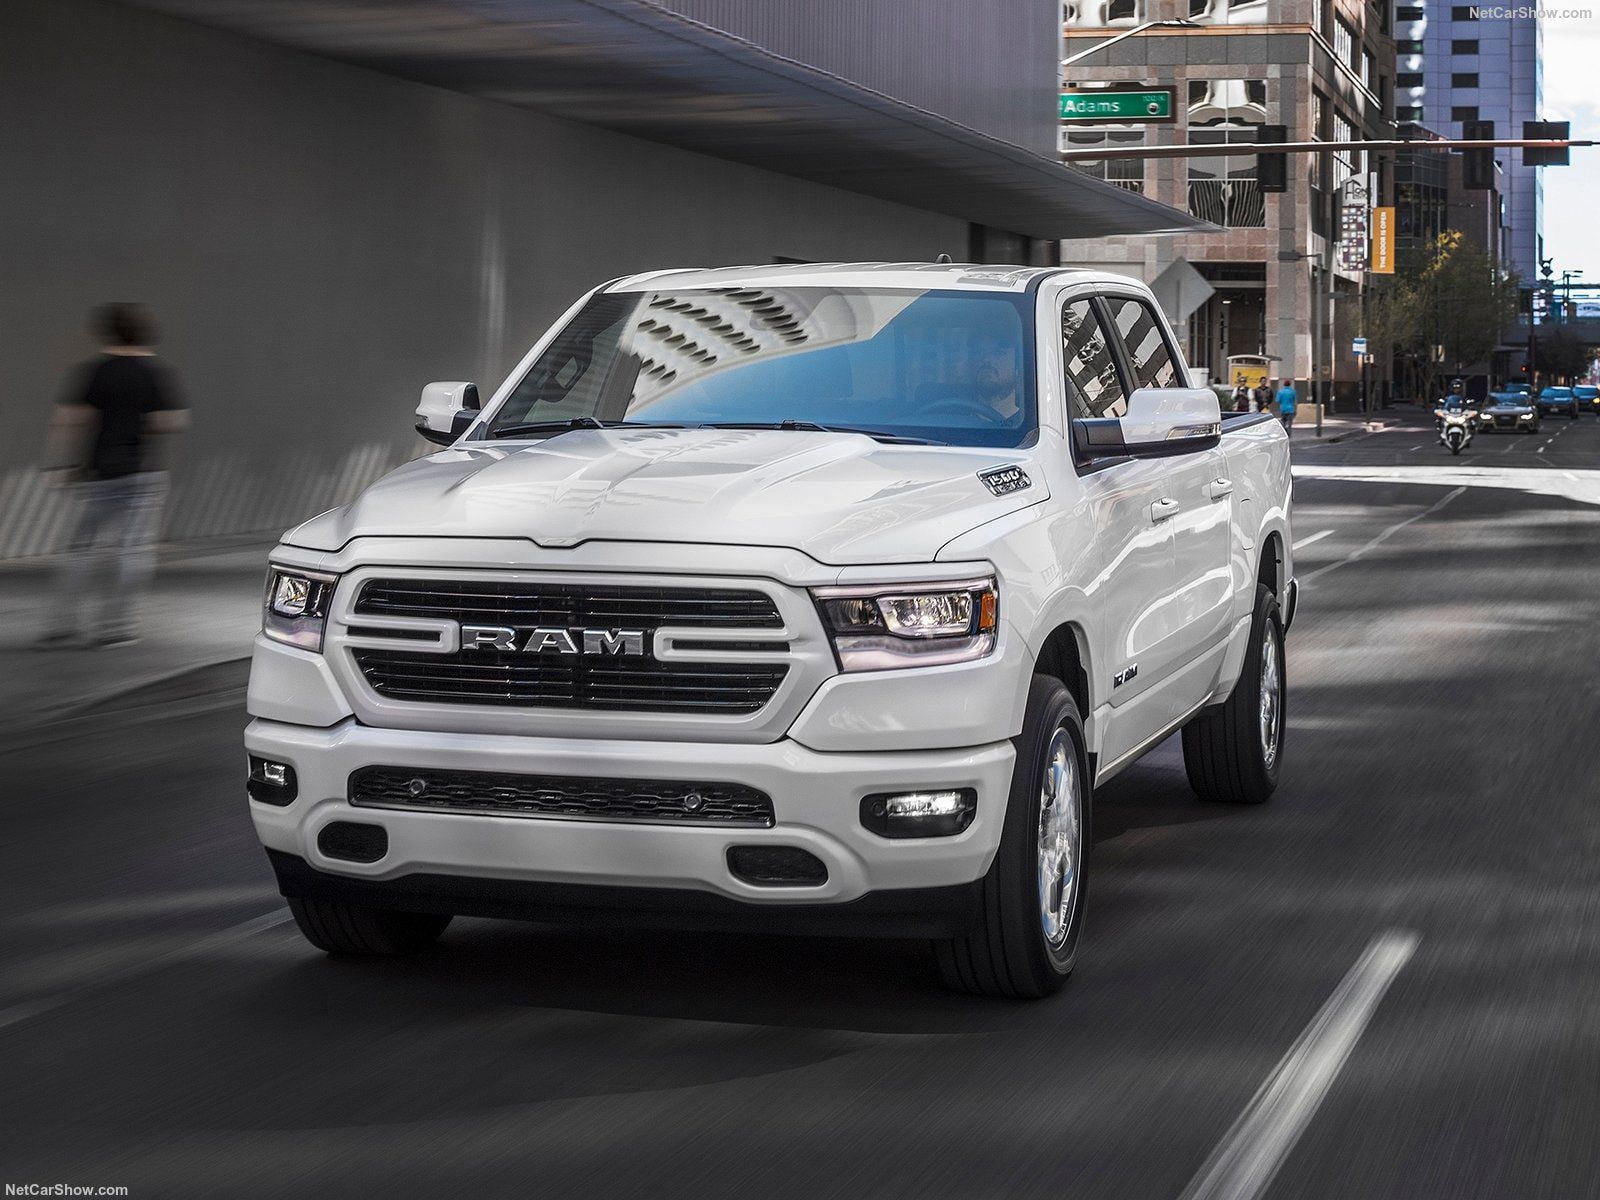
In fifth place and penalized by recent months score, Nissan with 1.34 million units (-6.6%) ahead of Jeep with 973.227 (+17.5%), Subaru with 680.135 (+5%), Hyundai with 667.635 (+0.4%), RAM with 597.367 (+7.3%) and in 10th place Kia with 589.673 (+0.1%).
At a model wise, the Ford F-series was the 2018 best-selling with 909.330 units sold (+1.4%) followed by the Chevrolet Silverado with 583.227 (-0.5%). In third place the Ram Pick with 536.980 (+7.2%).
In order to access to the Best Selling Cars ranking for this and the previous years, see here.
Research, Consulting, Data & Forecast
F2M covers intensively this market with several products developed to help any investigation required. Market Researches in PDF are immediately available for download with study on the market since 2005 and with forecast up to the 2025. AutoData in EXCEL are immediately downloadable with annual sales volume, split by month, for all brands and all models distributed in the market. This year data are released year to date, but you will receive a monthly update until the year-end. See details within USA Corner Store!
| Rank 2018 | Rank 2017 | Sales 2018 | Sales 2017 | '+/- 2018 | Share 2018 | |
|---|---|---|---|---|---|---|
| 1 | 1 | Ford | 2.381.635 | 2.464.041 | -3,3% | 13,7% |
| 2 | 2 | Toyota | 2.128.356 | 2.129.382 | 0,0% | 12,3% |
| 3 | 3 | Chevrolet | 2.034.474 | 2.065.883 | -1,5% | 11,7% |
| 4 | 4 | Honda | 1.445.897 | 1.486.827 | -2,8% | 8,3% |
| 5 | 5 | Nissan | 1.344.597 | 1.440.049 | -6,6% | 7,8% |
| 6 | 6 | Jeep | 973.227 | 828.522 | 17,5% | 5,6% |
| 7 | 8 | Subaru | 680.135 | 647.956 | 5,0% | 3,9% |
| 8 | 7 | Hyundai | 667.635 | 664.943 | 0,4% | 3,9% |
| 9 | 11 | Ram | 597.367 | 556.790 | 7,3% | 3,4% |
| 10 | 9 | Kia | 589.673 | 589.308 | 0,1% | 3,4% |
| 11 | 10 | GMC | 553.253 | 560.687 | -1,3% | 3,2% |
| 12 | 12 | Dodge | 459.324 | 446.996 | 2,8% | 2,6% |
| 13 | 14 | Volkswagen | 354.064 | 339.676 | 4,2% | 2,0% |
| 14 | 13 | Mercedes | 348.649 | 369.152 | -5,6% | 2,0% |
| 15 | 15 | BMW | 311.013 | 305.685 | 1,7% | 1,8% |
| 16 | 17 | Mazda | 300.325 | 289.470 | 3,7% | 1,7% |
| 17 | 16 | Lexus | 298.301 | 305.129 | -2,2% | 1,7% |
| 18 | 18 | Audi | 223.323 | 226.511 | -1,4% | 1,3% |
| 19 | 19 | Buick | 212.268 | 219.231 | -3,2% | 1,2% |
| 20 | 29 | Tesla | 196.402 | 50.327 | 290,3% | 1,1% |
| 21 | 20 | Chrysler | 165.964 | 188.545 | -12,0% | 1,0% |
| 22 | 22 | Acura | 158.934 | 154.602 | 2,8% | 0,9% |
| 23 | 21 | Cadillac | 152.926 | 156.440 | -2,2% | 0,9% |
| 24 | 23 | Infiniti | 149.280 | 153.415 | -2,7% | 0,9% |
| 25 | 25 | Mitsubishi | 118.074 | 103.686 | 13,9% | 0,7% |
| 26 | 24 | Lincoln | 103.587 | 111.159 | -6,8% | 0,6% |
| 27 | 26 | Volvo | 98.263 | 81.507 | 20,6% | 0,6% |
| 28 | 27 | Land Rover | 92.143 | 74.739 | 23,3% | 0,5% |
| 29 | 28 | Porsche | 57.202 | 55.420 | 3,2% | 0,3% |
| 30 | 30 | Mini | 43.684 | 47.102 | -7,3% | 0,3% |
| 31 | 31 | Jaguar | 30.483 | 39.594 | -23,0% | 0,2% |
| 32 | 35 | Alfa Romeo | 23.800 | 12.031 | 97,8% | 0,1% |
| 33 | 32 | Fiat | 15.521 | 26.492 | -41,4% | 0,1% |
| 34 | 34 | Maserati | 11.182 | 14.046 | -20,4% | 0,1% |
| 35 | 33 | Genesis | 10.312 | 20.612 | -50,0% | 0,1% |
| 36 | 37 | Ferrari | 2.318 | 2.538 | -8,7% | 0,0% |
| 37 | 38 | Bentley | 1.917 | 2.405 | -20,3% | 0,0% |
| 38 | 41 | McLaren | 1.574 | 1.018 | 54,5% | 0,0% |
| 39 | 36 | Smart | 1.276 | 3.071 | -58,5% | 0,0% |
| 40 | 39 | Rolls-Royce | 1.158 | 1.342 | -13,7% | 0,0% |
| Rank 2018 | Rank 2017 | Sales 2018 | Sales 2017 | '+/- 2018 | Share 2018 | |
|---|---|---|---|---|---|---|
| 1 | 1 | General Motors | 2.952.921 | 3.002.241 | -1,6% | 17,0% |
| 2 | 2 | Ford Group | 2.485.222 | 2.575.200 | -3,5% | 14,3% |
| 3 | 3 | Toyota Group | 2.426.660 | 2.434.511 | -0,3% | 14,0% |
| 4 | 4 | F.C.A. | 2.248.703 | 2.075.960 | 8,3% | 13,0% |
| 5 | 5 | Renault Nissan Alliance | 1.611.951 | 1.697.150 | -5,0% | 9,3% |
| 6 | 6 | Honda Motor | 1.604.831 | 1.641.429 | -2,2% | 9,3% |
| 7 | 7 | Hyundai-Kia | 1.267.620 | 1.274.863 | -0,6% | 7,3% |
| 8 | 8 | Subaru | 680.135 | 647.956 | 5,0% | 3,9% |
| 9 | 9 | Volkswagen Group | 637.631 | 625.131 | 2,0% | 3,7% |
| 10 | 11 | BMW | 355.855 | 354.129 | 0,5% | 2,1% |
| Rank 2018 | Rank 2017 | Model | Sales 2018 | Sales 2017 | '+/- 2018 |
|---|---|---|---|---|---|
| 1 | 1 | Ford F-Series | 909.330 | 896.764 | 1,4% |
| 2 | 2 | Chevrolet Silverado | 583.227 | 585.864 | -0,5% |
| 3 | 3 | Ram pick-up | 536.980 | 500.723 | 7,2% |
| 4 | 4 | Toyota RAV4 | 427.168 | 407.594 | 4,8% |
| 5 | 5 | Nissan Rogue | 412.110 | 403.465 | 2,1% |
| 6 | 7 | Honda CR-V | 379.013 | 377.895 | 0,3% |
| 7 | 6 | Toyota Camry | 343.439 | 387.081 | -11,3% |
| 8 | 12 | Chevrolet Equinox | 332.552 | 290.458 | 14,5% |
| 9 | 8 | Honda Civic | 325.760 | 377.286 | -13,7% |
| 10 | 9 | Toyota Corolla | 303.732 | 329.196 | -7,7% |
| 11 | 10 | Honda Accord | 291.071 | 322.655 | -9,8% |
| 12 | 11 | Ford Escape | 272.228 | 308.296 | -11,7% |
| 13 | 13 | Ford Explorer | 261.571 | 271.131 | -3,5% |
| 14 | 21 | Toyota Tacoma | 245.658 | 198.124 | 24,0% |
| 15 | 18 | Toyota Highlander | 244.511 | 215.775 | 13,3% |
| 16 | 22 | Jeep Wrangler | 240.031 | 190.522 | 26,0% |
| 17 | 27 | Jeep Cherokee | 239.437 | 169.882 | 40,9% |
| 18 | 15 | Jeep Grand Cherokee | 224.908 | 240.696 | -6,6% |
| 19 | 16 | Nissan Sentra | 213.046 | 218.451 | -2,5% |
| 20 | 17 | GMC Sierra | 211.314 | 217.943 | -3,0% |
| 21 | 14 | Nissan Altima | 209.146 | 254.996 | -18,0% |
| 22 | 20 | Hyundai Elantra | 200.415 | 198.210 | 1,1% |
| 23 | 23 | Subaru Outback | 178.853 | 188.886 | -5,3% |
| 24 | 19 | Ford Fusion | 173.600 | 209.623 | -17,2% |
| 25 | 26 | Subaru Forester | 171.613 | 177.563 | -3,4% |
| 26 | 61 | Jeep Compass | 171.167 | 83.253 | 105,6% |
| 27 | 35 | Honda Pilot | 159.615 | 127.279 | 25,4% |
| 28 | 36 | Dodge Grand Caravan | 151.927 | 125.196 | 21,4% |
| 29 | 33 | Mazda CX-5 | 150.522 | 127.563 | 18,0% |
| 30 | 25 | Chevrolet Cruze | 147.149 | 184.751 | -20,4% |


