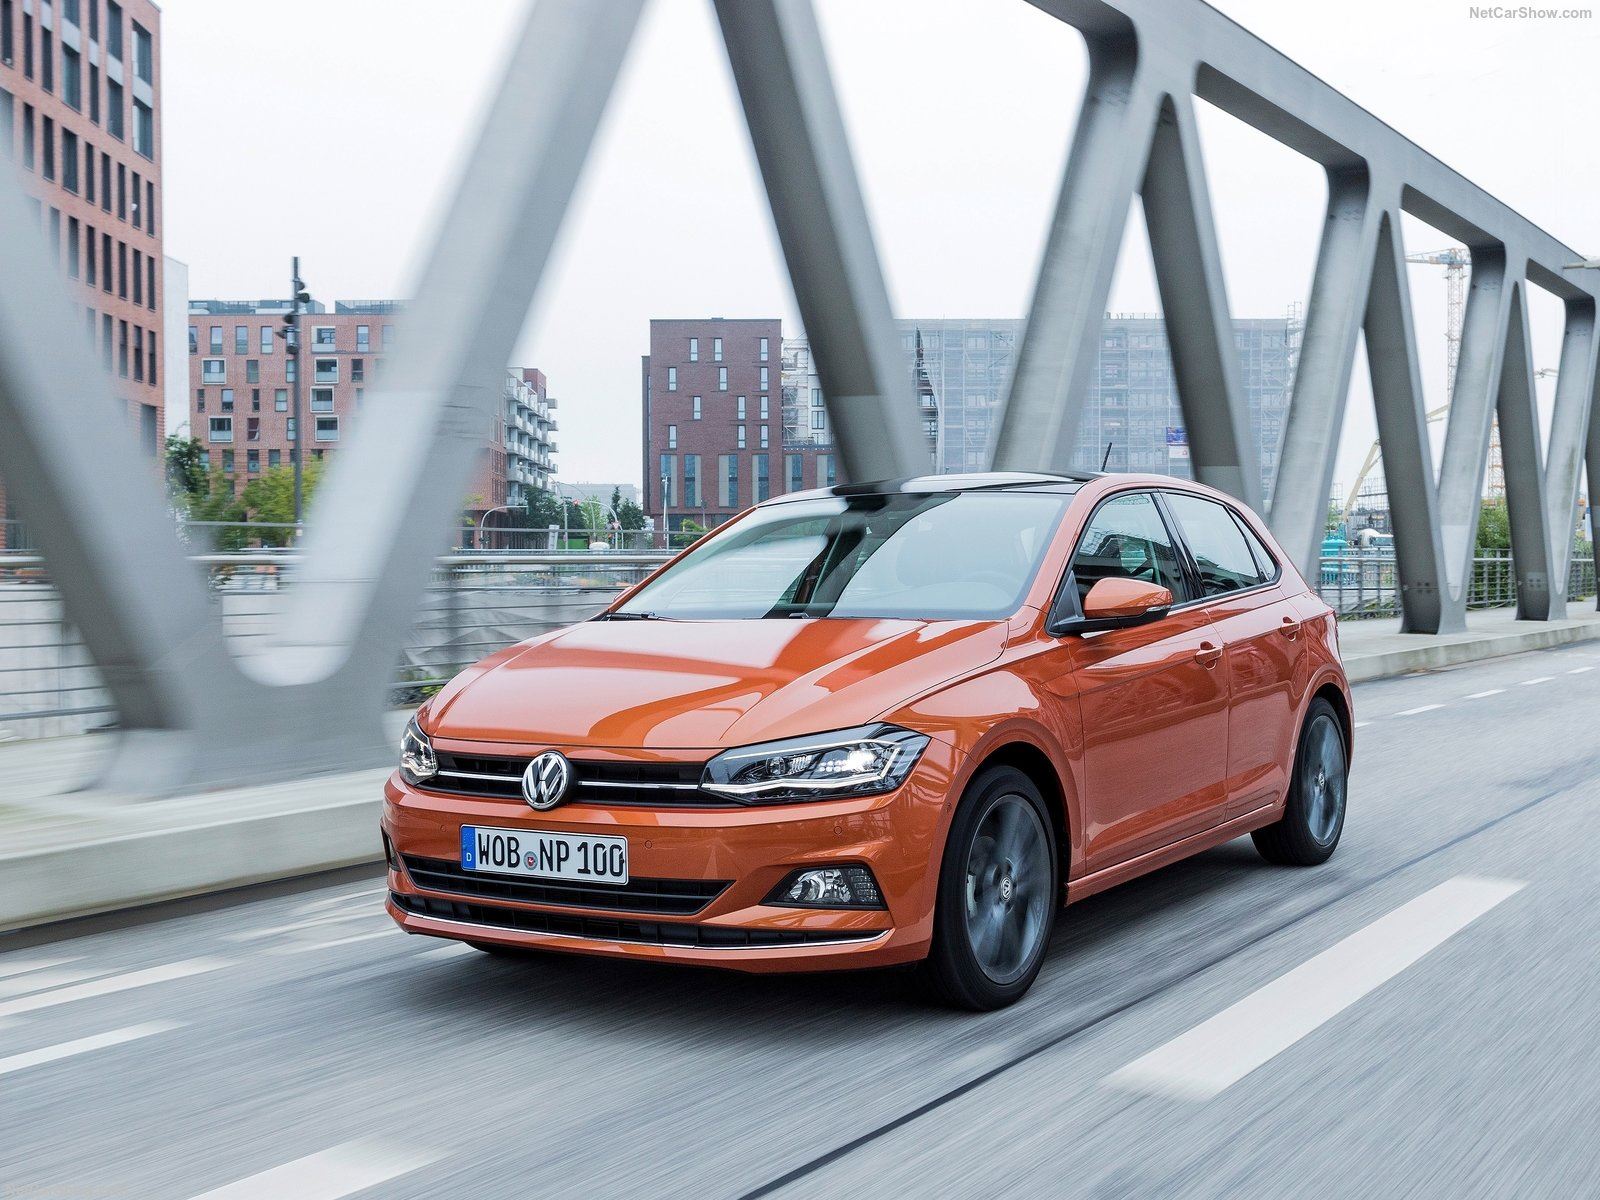
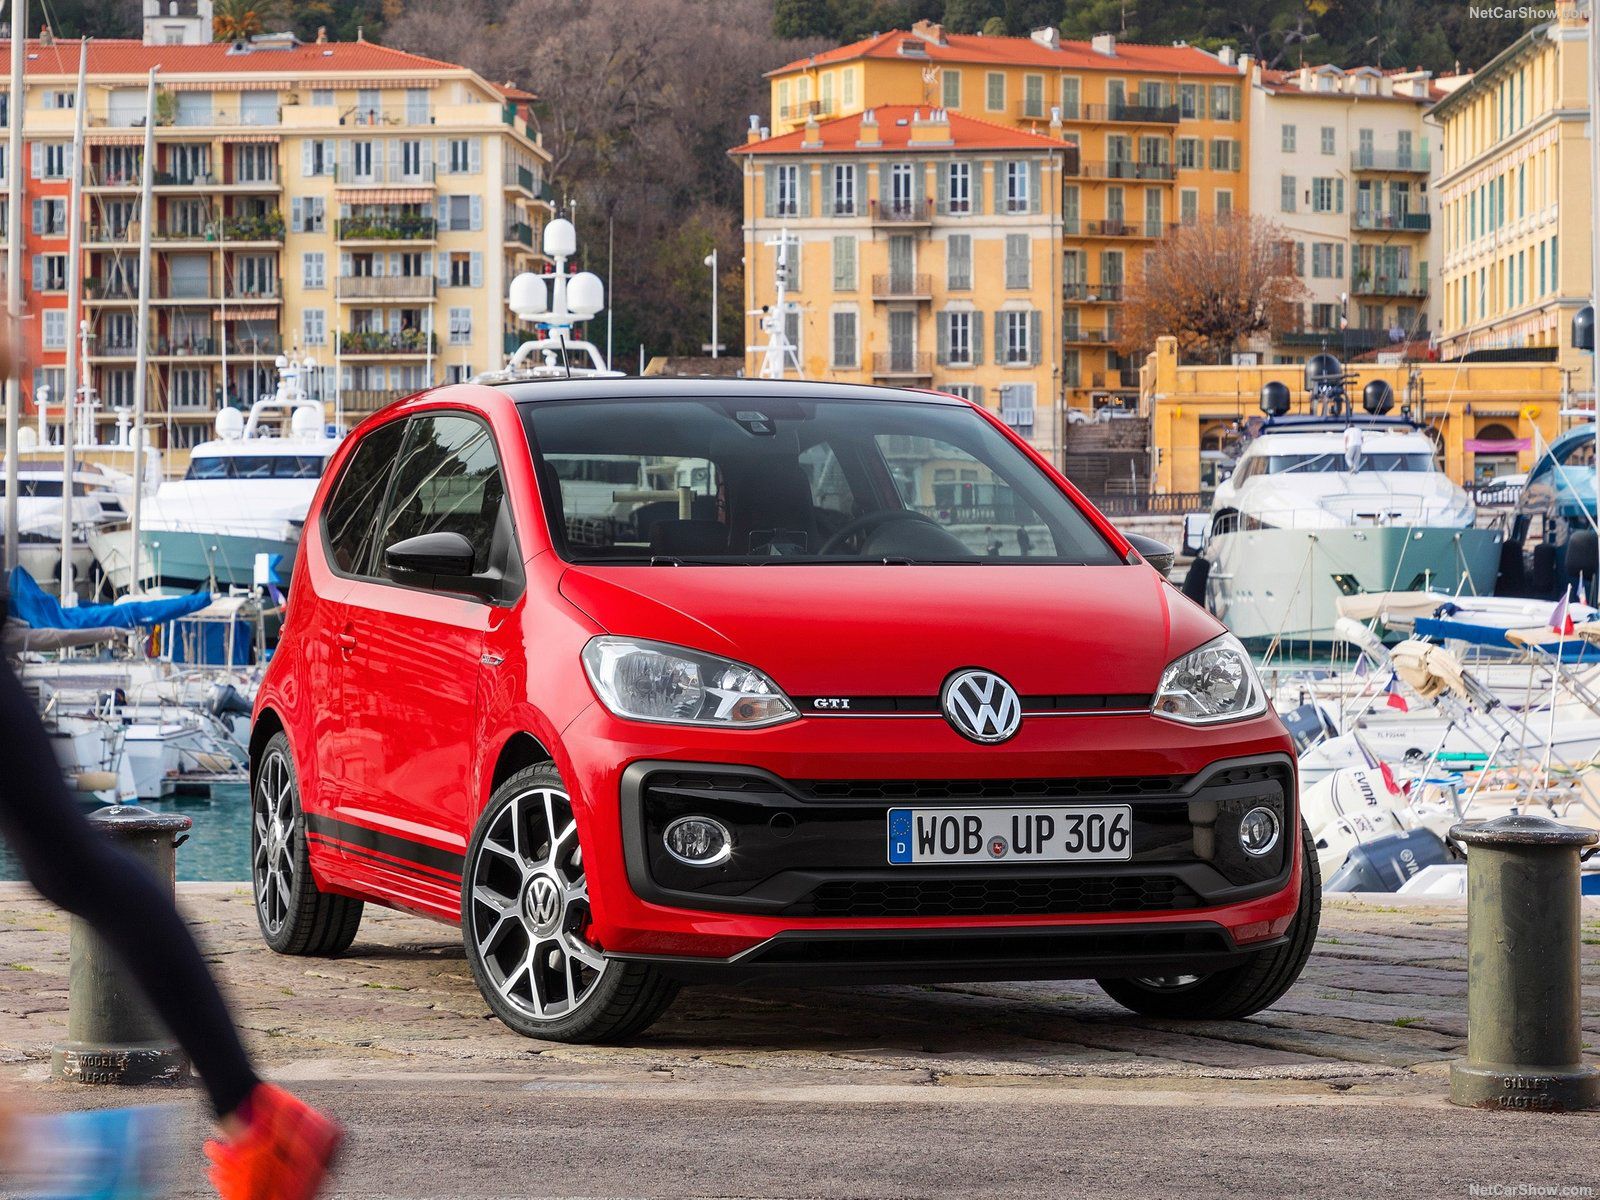
San Marino Vehicles Market in 2016 broke the prolongued sales decline with a timid increase. Volkswagen led the ranking despite the sales losses, while Audi shined in double digit.
Market Outlook
Particularly affected by the 2008 international financial crisis, the territory of San Marino has fallen into a deep recession, from which it seems to have only just come out. After contracting by -4.5% in 2013, the country’s economic growth recovered, yet remained negative in 2014 (-1%). As the economy stabilises and relations with Italy improve, the country has returned to positive growth in 2015 (1%).
Following the sixth consecutive annual sales decline, finally the new vehicles market in 2016 posted the first positive albeit very little. Indeed according to data released by the San Marino Bureau of Statistics, the new vehicles market sold have been 1.031 (+1.1%).
Competitive Arena
Volkswagen kept the leadership for the third year in string with 161 units (-8.0%) and 15.8% of market share. As in 2015, Audi was in second place with 147 sales (+14.8%) ahead of Fiat with 107 (+4.9%).
Below, you can sort our interactive tables to see data regarding Brands, Groups and Models. Please bear in mind that sales data are subject to adjustments as sources will update their information. This report is updated at the publishing date and will not be modified while the next on this subject will always have the year to date data updated.
| Rank 2016 | Rank 2015 | BRAND | Sales 2016 | Sales 2015 | Variation 2016 | Share 2016 | Share 2015 |
|---|---|---|---|---|---|---|---|
| 1 | 1 | Volkswagen | 161 | 175 | -8,0% | 15,8% | 17,5% |
| 2 | 2 | Audi | 147 | 128 | 14,8% | 14,5% | 12,8% |
| 3 | 3 | Fiat | 107 | 102 | 4,9% | 10,5% | 10,2% |
| 4 | 5 | Suzuki | 76 | 57 | 32,8% | 7,5% | 5,7% |
| 5 | 4 | Opel | 50 | 67 | -25,4% | 4,9% | 6,7% |
| 6 | 8 | Toyota | 46 | 38 | 21,9% | 4,6% | 3,8% |
| 7 | 9 | Mercedes | 43 | 37 | 16,2% | 4,2% | 3,7% |
| 7 | 7 | Renault | 43 | 42 | 2,4% | 4,2% | 4,2% |
| 8 | 11 | Seat | 38 | 28 | 35,7% | 3,7% | 2,8% |
| 9 | 9 | BMW | 37 | 37 | 0,0% | 3,6% | 3,7% |
| 10 | 6 | Land Rover | 30 | 44 | -31,8% | 3,0% | 4,4% |
| 11 | 10 | Ford | 29 | 30 | -3,3% | 2,9% | 3,0% |
| 12 | 8 | Jeep | 26 | 38 | -31,6% | 2,6% | 3,8% |
| 13 | 17 | Dacia | 23 | 13 | 76,9% | 2,3% | 1,3% |
| 13 | 19 | Kia | 23 | 10 | 130,0% | 2,3% | 1,0% |
| 14 | 12 | Peugeot | 21 | 22 | -4,5% | 2,1% | 2,2% |
| 15 | 15 | Nissan | 17 | 16 | 6,3% | 1,7% | 1,6% |
| 16 | 13 | Porsche | 16 | 18 | -11,1% | 1,6% | 1,8% |
| 17 | 14 | Hyundai | 14 | 17 | -17,6% | 1,4% | 1,7% |
| 18 | 13 | Citroen | 12 | 18 | -33,3% | 1,2% | 1,8% |
| 19 | 16 | Volvo | 9 | 14 | -36,5% | 0,9% | 1,4% |
| 20 | 20 | Lancia | 7 | 9 | -22,2% | 0,7% | 0,9% |
| 21 | 21 | Honda | 6 | 8 | -25,0% | 0,6% | 0,8% |
| 21 | 22 | Mazda | 6 | 5 | 20,0% | 0,6% | 0,5% |
| 22 | 23 | Maserati | 5 | 3 | 66,7% | 0,5% | 0,3% |
| 22 | 22 | Mitsubishi | 5 | 5 | 0,0% | 0,5% | 0,5% |
| 23 | 25 | Mini | 4 | 1 | 300,0% | 0,4% | 0,1% |
| 24 | 18 | Subaru | 3 | 11 | -72,1% | 0,3% | 1,1% |
| 24 | 26 | Jaguar | 3 | - | 0,3% | 0,0% | |
| 24 | 23 | Ferrari | 3 | 3 | 0,0% | 0,3% | 0,3% |
| 24 | 24 | Smart | 3 | 2 | 50,0% | 0,3% | 0,2% |
| 24 | 26 | Alfa Romeo | 3 | - | 0,3% | 0,0% | |
| 25 | 24 | Chrysler | - | 2 | -100,0% | 0,0% | 0,2% |
| Rank 2016 | Rank 2015 | Group | Sales 2015 | Sales 2016 | Variation 2016 | Share 2016 | Share 2015 |
|---|---|---|---|---|---|---|---|
| 1 | 1 | Volkswagen | 349 | 362 | 3,7% | 35,6% | 34,9% |
| 2 | 2 | FCA | 157 | 151 | -3,8% | 14,9% | 15,7% |
| 3 | 3 | Renault-Nissan | 71 | 83 | 16,9% | 8,2% | 7,1% |
| 4 | 5 | Suzuki | 57 | 76 | 32,8% | 7,5% | 5,7% |
| 5 | 4 | General Motors | 67 | 50 | -25,4% | 4,9% | 6,7% |
| 6 | 9 | Toyota | 38 | 46 | 21,9% | 4,6% | 3,8% |
| 7 | 8 | Mercedes Daimler | 39 | 46 | 17,9% | 4,5% | 3,9% |
| 8 | 9 | BMW | 38 | 41 | 7,9% | 4,0% | 3,8% |
| 9 | 11 | Hyundai-Kia | 27 | 37 | 37,0% | 3,6% | 2,7% |
| 10 | 7 | PSA | 40 | 33 | -17,5% | 3,2% | 4,0% |
| 10 | 6 | Tata | 44 | 33 | -25,0% | 3,2% | 4,4% |


